Fulfilling Your Strategy
Learn how to monitor, execute, and track your trading strategy using Kollit's comprehensive dashboard and tools.
1. Strategy Dashboard Overview
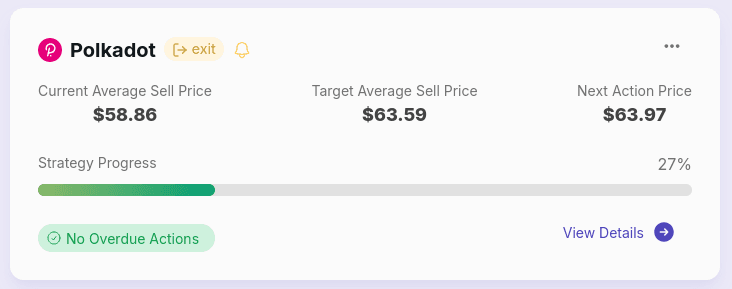
After creating a strategy, it appears on your Strategies tab. Each strategy card provides essential information for tracking your progress.

Key Performance Metrics
- Current Average Execution Price:
The average price at which you've executed trades so far
- Target Execution Price:
The ideal average price you're aiming to achieve
- Next Action Price:
The price at which you should execute your next trade
Progress Indicators
- Progress Bar:
Visual representation of how much of the strategy you've completed
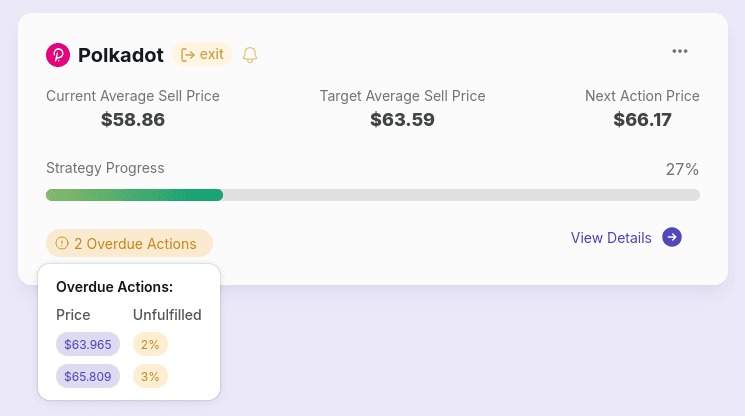
- Action Warnings:
Located in the bottom left, indicates missed actions or opportunities
Card Actions
- View Details Button:
Access comprehensive strategy information and tracking tools
- Menu Options:
Includes strategy deletion (note: this action is irreversible)
Important Notes About Warnings:
- • Hover over warnings to see detailed information about missed actions
- • A warning typically indicates you can still execute the action for potentially better outcomes
- • The price at the time of the warning may be more favorable than the original target

2. Detailed Strategy View
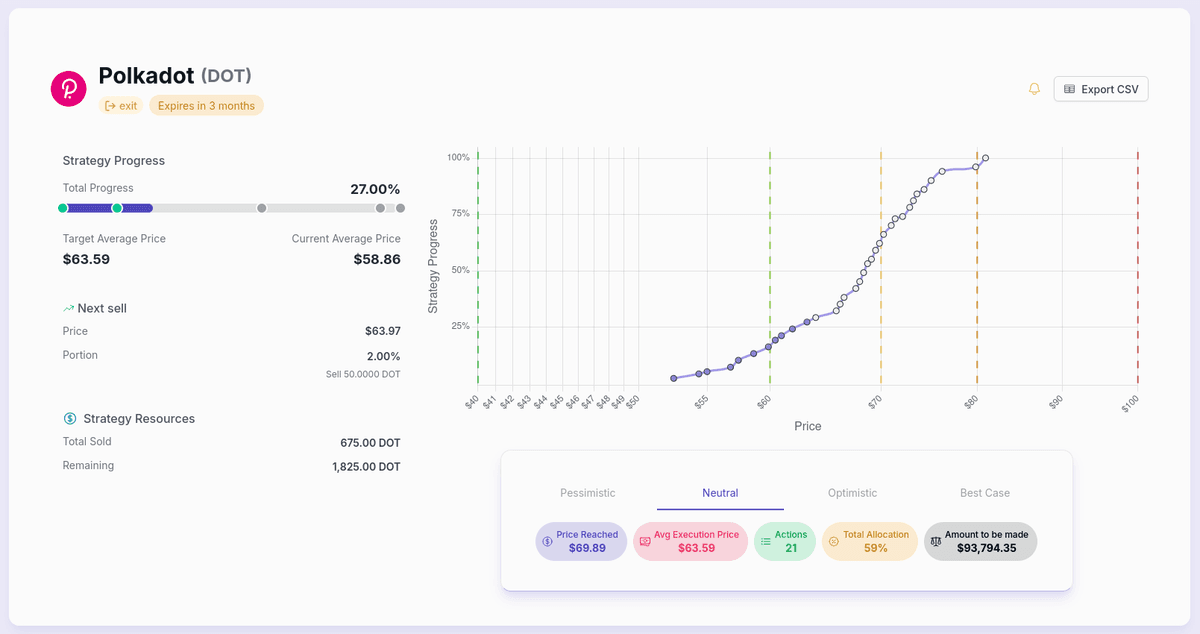
The detailed view provides comprehensive tools and information for managing your strategy. Access it by clicking "View Details" on any strategy card.

1. Scenario Progress Tracking
- Scenario Fulfillment:
Each scenario turns green when you've executed enough actions to fulfill its requirements
- Action Summaries:
Compare completed actions against scenario targets
2. Next Action Widget
- Target Information:
- Price target for next action
- Portion to trade (percentage)
- Specific amount to buy/sell (if resources were specified)
3. Resource Allocation Monitor
Only visible if resources were specified during strategy creation
- Resource Tracking:
- Amount of assets used so far
- Remaining resources available
- Percentage of total allocation utilized
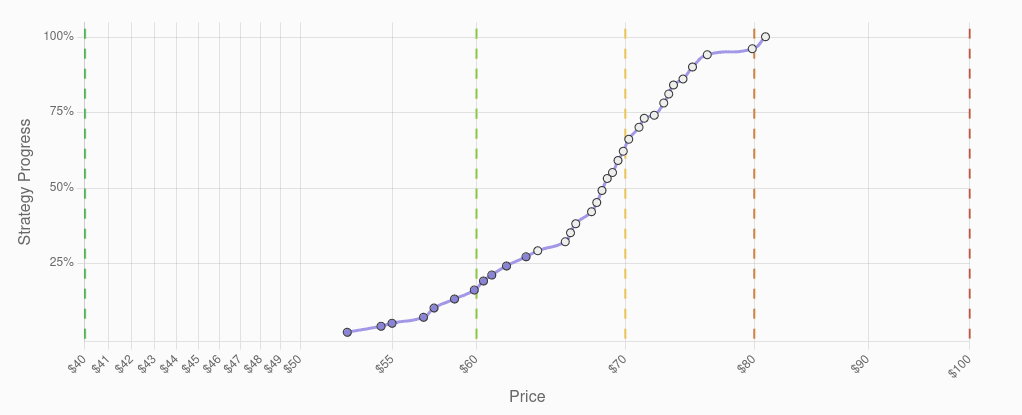
4. Interactive Strategy Graph

- Action Points:
Initially blank points that can be clicked to mark actions as completed
- Prediction Lines:
Vertical dashed lines representing your prediction price points:
- Baseline
- Pessimistic
- 50/50
- Optimistic
- Highly Unlikely
5. Scenario Browser
- Performance Tracking:
Monitor strategy performance across different market scenarios based on your prediction
3. Additional Features
Email Notifications
Enable email notifications to receive alerts when:
- Action price points are reached
- Important strategy milestones occur
Export Functionality
Export your strategy details to CSV format for:
- Offline analysis and tracking
- Custom modifications and calculations
- Record keeping and documentation
Best Practices
- Regular Monitoring
Check your strategy dashboard frequently to stay on top of market movements and required actions
- Update Progress Promptly
Mark completed actions immediately to maintain accurate tracking and avoid missing opportunities
- Pay Attention to Warnings
Review warning indicators regularly as they may signal better execution opportunities
- Enable Notifications
Set up email notifications to stay informed of action points and important updates
- Regular Scenario Review
Use the scenario browser frequently to understand how your strategy is performing against different market conditions
Next Steps
To make the most of your strategy:
- Follow Your Strategy
Track your progress by marking completed actions. With your strategy in place, you can trade confidently knowing exactly what steps to take at each price level.
- Export Your Strategy
Download your strategy details for offline reference and analysis